
Start measuring your KPIs from the first day

When you are launching a new startup, measuring your KPIs does not seem like a priority. You probably don’t have customers, revenue, a team, or even a product yet, just an MVP. So why bother?
Here, I explain why it is important to measure everything from the first day your startup is running. If you want to know more about what are KPIs, and which ones you should measure, in this other article, I describe the most common KPIs and how to find those special KPIs that matter to your business. You may want to check out that one first.
The Importance Of Measuring Your KPIs From The First Day
When I started Companio, at the end of 2018, I was not thinking about KPIs or measuring anything. I was working hard to create a business from scratch, and trying to figure out if it would work. During 2019, we acquired our first customers, got our official license to register companies in Estonia and started to grow. 2020 was an exciting year of growth, both in terms of customers and in terms of the team, but I never seemed to find the time to measure our KPIs seriously until 2021. We actually didn’t have a well-organized document with all our KPIs until our COO joined the company at the end of that year.
That’s more common that you may think. It happens to a lot of startups, and it is a big mistake for two reasons.
Firstly, because you will eventually need this data for investors when you decide to raise funds, or in the case of an exit. And investors, business angels, or potential acquirers will want to see historical financial data, from revenue and expenses to new customers and month over month growth.
It doesn’t matter if your startup is pre-revenue, even pre-seed investors will want to check the progress of the company, at least, in terms of users. Not having this data will hamper your fundraising options.
Secondly, and most importantly, because if you are not measuring your KPIs, you are not understanding how your business is going and you are incapable of taking the educated decisions that will make your startup grow. It’s that simple. You are driving blind.
I now regret not paying attention to KPIs before. I should have measured them from the very first day. If you are not doing it already, I urge you to start today. If you are about to launch your startup, I encourage you to keep this in mind and start measuring your KPIs from the start.
What KPIs should I measure?
In this article, I describe the most common KPIs that startups usually want to measure, and talk about these other KPIs nobody talks about but are the ones that matter to your business.
TL;DR: you should measure at least the most common KPIs (the ones that investors may ask about in the future), and also those specific metrics of your business that really matter, the ones that only make sense for your business (I talk about these in more detail in the article above).
Who Should Be In Charge Of Measuring Your KPIs?
As the authority in all things operational, the task of measuring KPIs usually falls to the COO of the company. If you don’t have one yet, the CEO of the company should be the one in charge of doing this.
However, I would encourage you to engage your whole team, or at least the C-Levels, in this process. Each KPI is obviously the area of expertise of one C-Level, from revenue and expenses (CFO) to new customers, conversions, traffic and visitors (CMO), from tickets solved and answered and average time to solve and answer them (Chief of Support) to new features implemented and bugs solved (CTO).
Involving the C-Levels in this process not only will give them ownership into their respective areas of responsibility, it will make them understand the importance of improving these KPIs and will engage everybody in the growth of the startup.
How To Track These KPIs Correctly
You don’t need fancy software tools to do it. All you need is a shared spreadsheet (like Google Sheets) that can be accessed online by your team. List all the KPIs you are going to track in one column, alongside the responsible person, and add one column per month. You can separate different years in different tabs.
For KPIs that measure the increase or decrease of certain value month over month, the standard formula is:
(current value - previous value) / current valueSo for example, in the image below, the MRR growth % of February 2022 can be calculated as:
(106,278 - 104,289) / 106,278 = 1.87%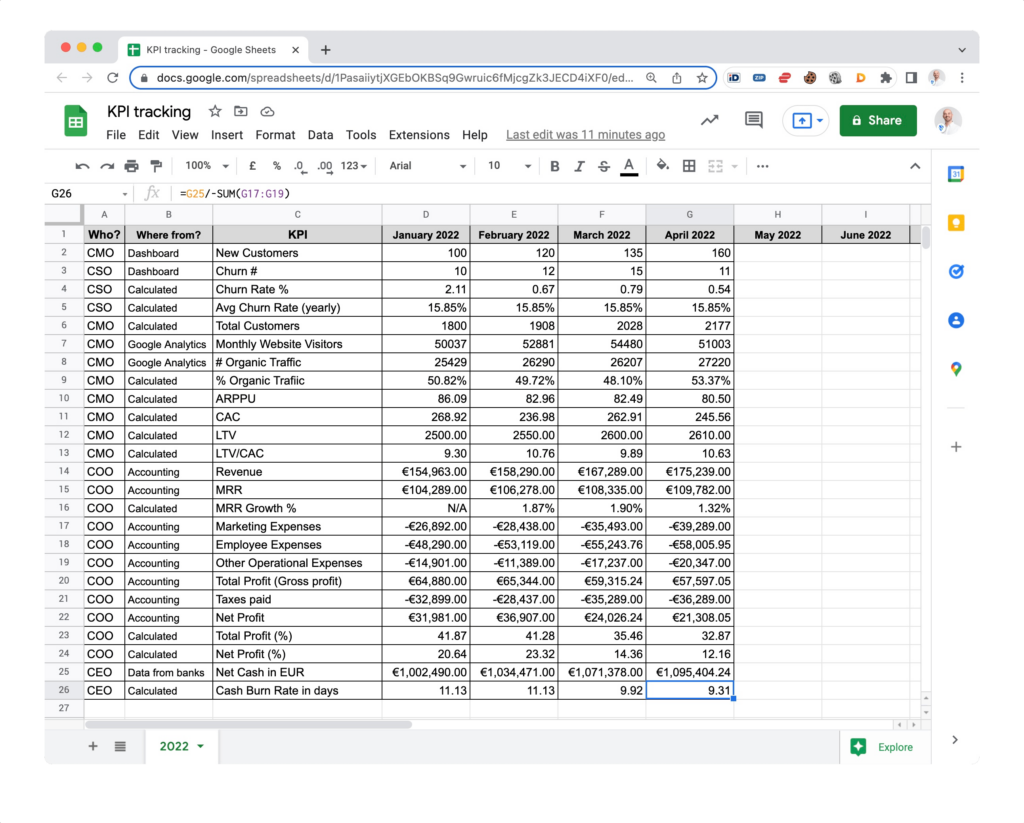
Use the power of formulas and automatic calculations to generate all the calculated values that depend on other numbers, such as ARPPU, LTV/CAC, Profit percentages, etc.
Taking Action
Measuring your KPIs from the first day is not only benefitial to track the progress and growth of your company, it is essential to make educated decisions, both operational and strategical.
Analyzing Changes
You must use your KPI tracking document as a guide to make decisions based on data. When your startup tries new ideas, or tests important changes, use this data to understand if you want to continue developing them or you need to take a different approach. These experiments may include important change in fees, extra services, functionality and marketing strategies, or small changes like changing the copies of your website or the color of your Sign Up button.
Discovering Hidden Relationships between the data
Rarely will a single KPI change in an isolated way. Most of the times, the change observed in one variable is caused by, or will affect, one or several others. This is usually studied a regression analysis, and it includes two types of situations you must be aware of.
- Simple regression establishes the relationship between two variables, or how changes in one variable affect another. For example, if the expenses remain the same, an increase in revenue will mean an increase in profit.
- Multiple regression models complex relationships between the data, involving more than two variables. For example, the sum of the different expenses, variations in revenue, and changes in fiscal and tax policies will affect the net profit.
Some of these relatioships are obvious, specially those based on mathematical relatioships (i.e: reducing expenses and increasing your revenue leads to an increased profit). However, the ones that are most relevant are those that can’t be inferred directly.
One example for us was the organic traffic. We discovered that an increased percentage and amount of organic traffic had a bigger influence in the number of new customers per month than other most obvious variables, such as the marketing expenditure. We concluded that organic traffic was the most important source of customers for us.
These hidden relatioships depend a lot on your business. Maybe increasing your fees and spending more money in marketing and UI/UX creates an image of “Premium service” that brings you more customers. Perhaps launching a “Free February” offer (join now for free and start paying in May!) decreases your MRR growth initially but skyrockets your customer acquisition, and hence the revenue and MRR starting from May…
Once you have the data in place, you can make educated decisions and understand the effect of those decisions. Remember, though, that correlation does not imply causation. Sometimes figuring out these relationships will be easy, and other times, it will be harder due to the number of variables, decisions, and changes in action.
Start measuring your KPIs today
I hope I have convinced you of the benefits of measuring your KPIs from the first day. So get down to business! Create a spreadsheet right now and start measuring and tracking your KPIs. Your future self will thank you.


Comments ()